

For the past few months, I’ve seen some Democratic partisans express optimism about Cyndi Munson’s chances. Just odd posts on Facebook and Twitter, some of them accumulating a triple digit number of likes: big numbers in a small market. There have also been some minor defections within the Republican camp, possibly dissatisfied with Mike Mazzei’s slim victory in this past August’s GOP primary runoff.
I think Mike Mazzei is as good as governor, but I was curious: what would it take for Munson to win? To test this question, I made a model.1
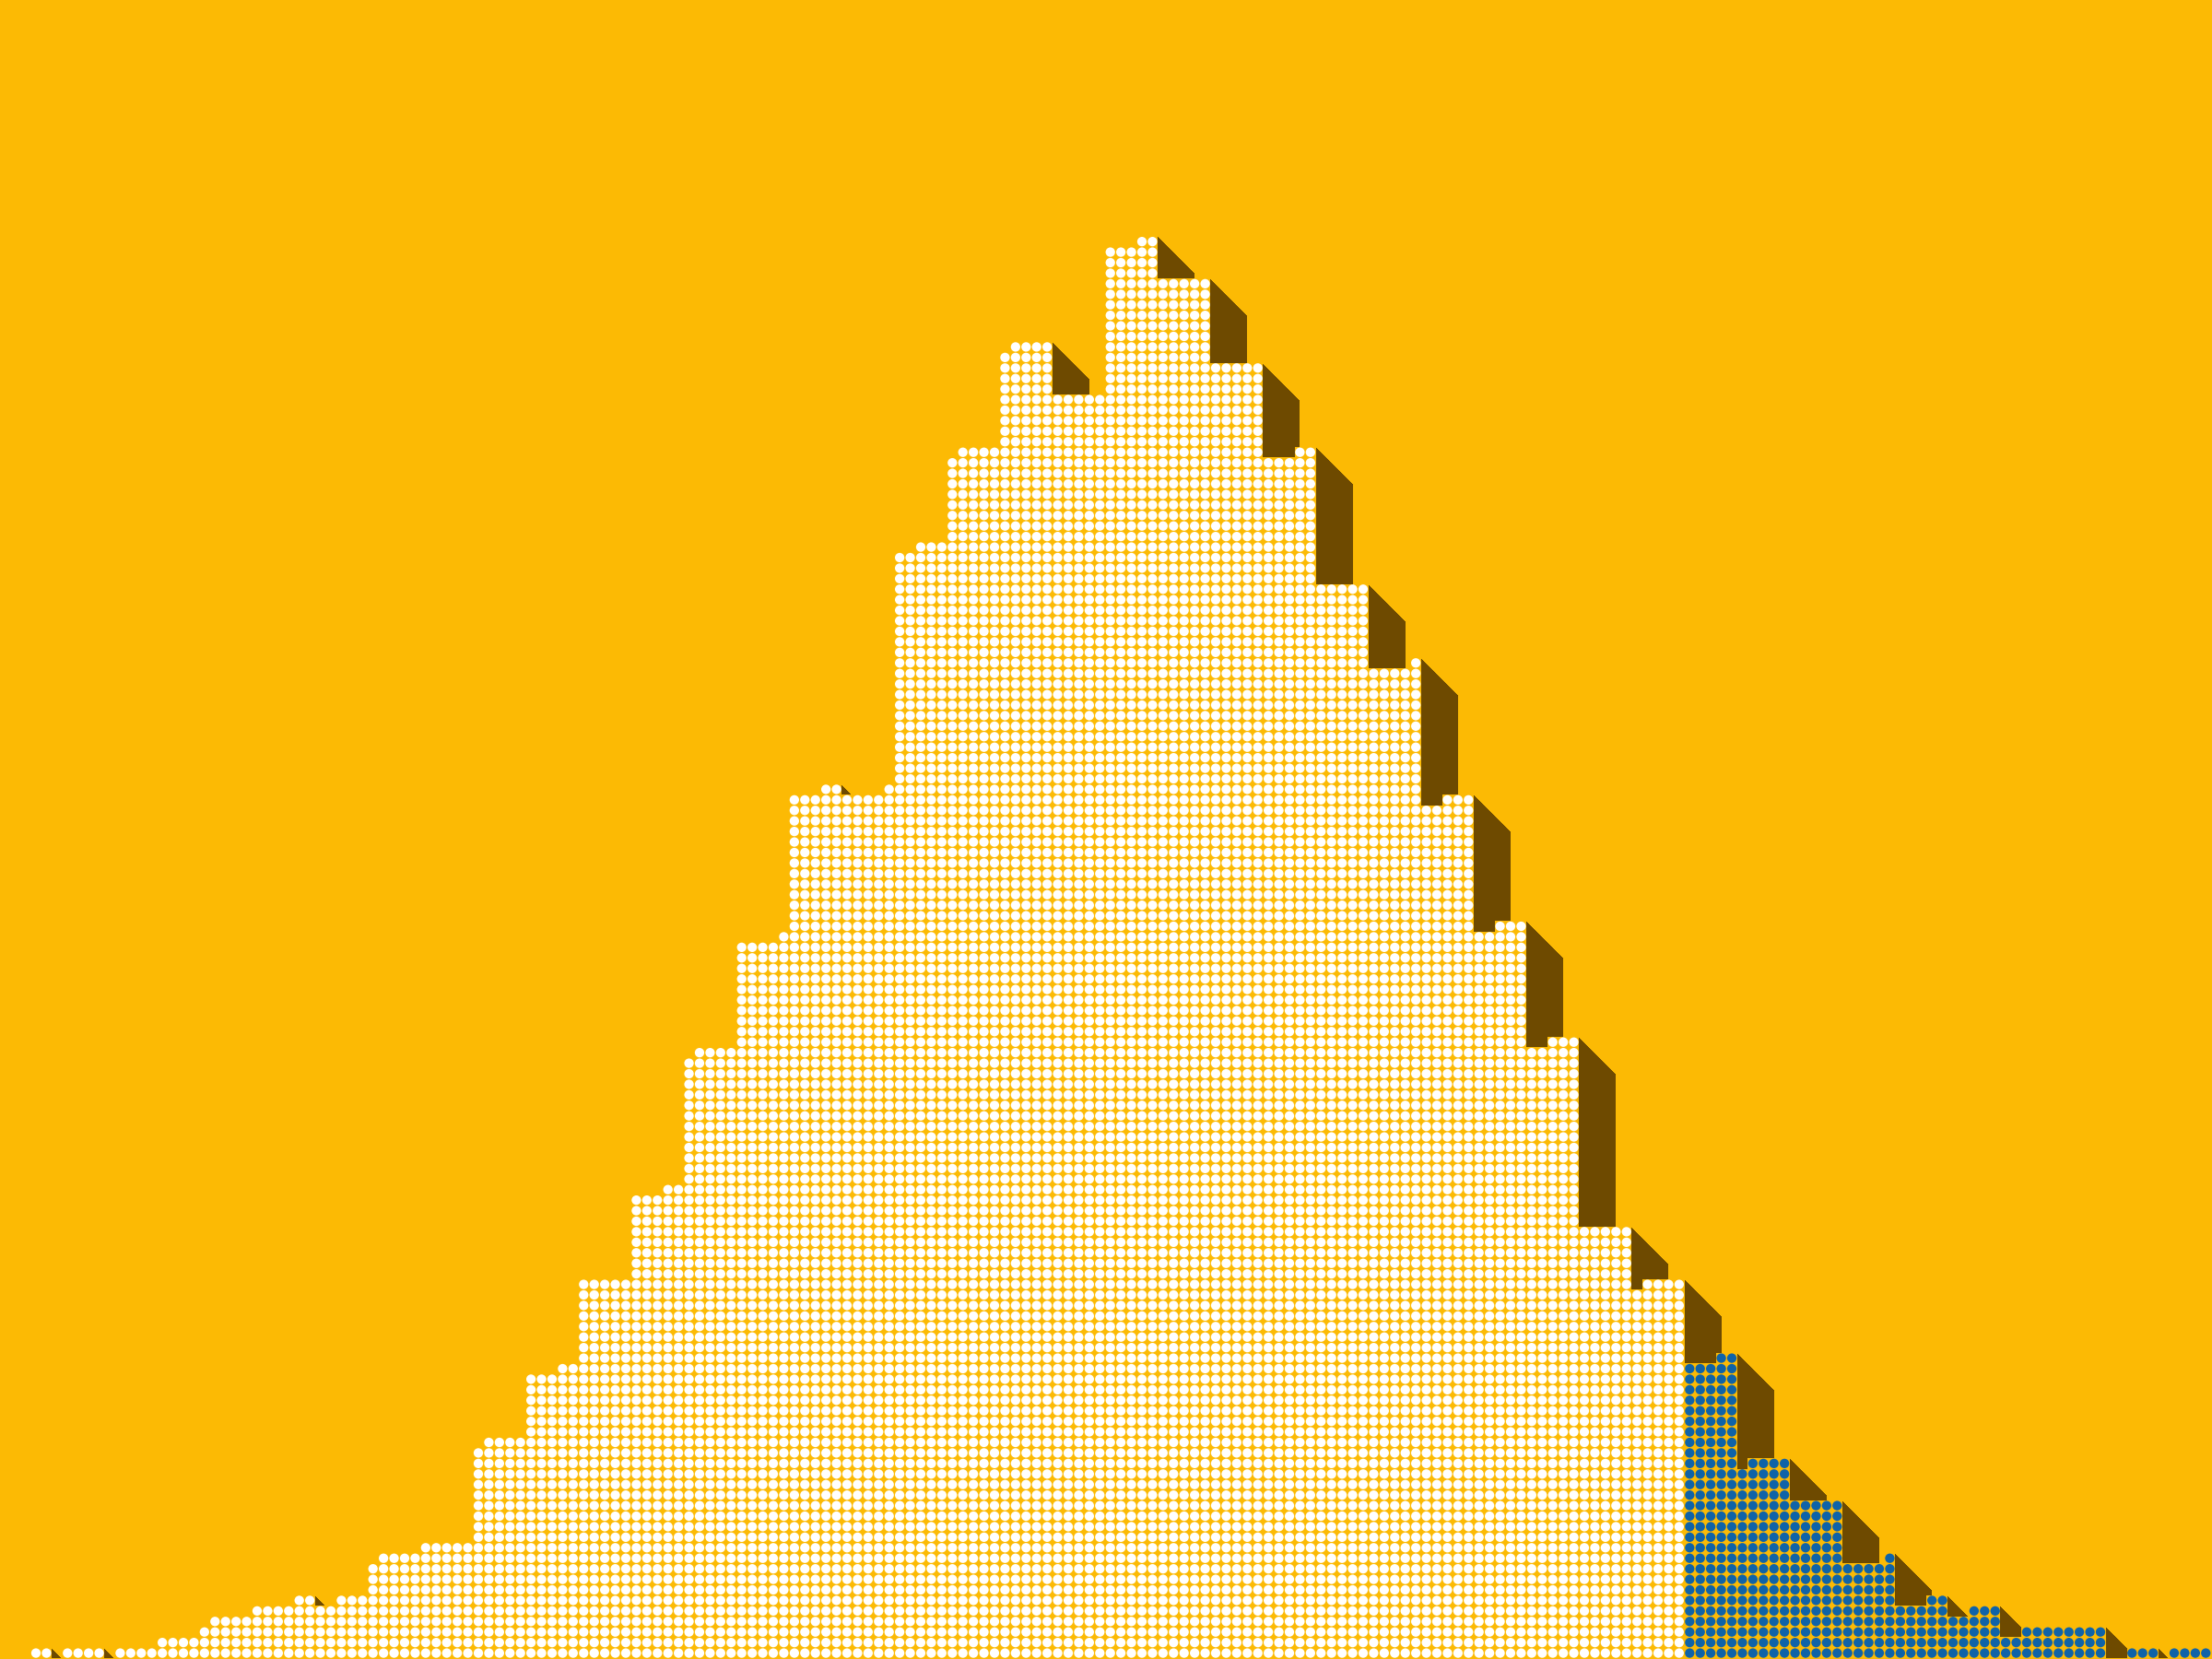
A model is a term we use in political science to refer to a set of variables derived from previous data and weighted based on certain assumptions that we can use to make inferences about the future. Put another way, it’s how we predict the future in a scientific way. Everyone uses models every day. In fact, it’d be hard to do without them. If you see a marble rolling across a flat surface, your mental model of the world may tell you that objects in motion stay in motion and that the marble is apt to continue rolling along that surface.
In political science, however, we aren’t playing with marbles—we’re playing with people. Human behavior, unlike marble behavior, is not tied to the laws of physics. And often, we’re not even able to play with individual people, but with groups of people with different characteristics about whom we can only derive limited information. We’re dealing with uncertainty.
One fantastic example of this principle is Norm MacDonald’s joke about the professor of logic. It goes something like this:
One day, Norm meets a professor at a university who studies logic. Norm asks what exactly logic is. The professor of logic pauses for a moment and decides to explain logic by way of example. He asks Norm whether he owns a doghouse. Norm answers in the affirmative. From the existence of a doghouse, the professor constructs a chain of deductions: Norm must own a dog, must have children, must be married, and therefore must be heterosexual.
Norm is impressed. The next day, he tries the same technique on a man standing next to him at a bus stop. He asks whether the man owns a doghouse. When the man says no, Norm concludes that he must be gay.
When we’re dealing with datasets in political science, we might only ever know whether someone owns a doghouse. As a consequence, even a good model might end up calling a lot of people gay.
Oklahoma is a terrible state to analyze politics in, partly because we have so little data. In the entire general election cycle, we’ve seen just five public polls. Four of these polls had a margin of error of more than 10%. The fifth poll, commissioned by the Munson campaign, reported that Cyndi Munson was set to post the most impressive performance by any Democratic candidate in Oklahoma since Brad Henry. Hard sell.
Oklahoma is also data constrained for a more interesting reason: in the past twenty years, our politics has re-aligned. State politics in Oklahoma used to have two competitive parties, and maps were split along a Northwest-Southeast axis. Now, it is Republican-dominant, and general elections are split rural-urban. This will be our fifth gubernatorial election under a one-party dominant system, and it will probably be our third with a predominant rural-urban split.
So without great data, how does one make a decent model? Well, I tried a lot of weird things, but here’s what seemed to work:
First, fundamentals. The model splits Oklahoma in two between the three metro counties (Oklahoma, Tulsa, Cleveland) and the other 74. The model’s first job is to evaluate how Democratic or Republican each county is compared with the rest of its group based on an average of the results of the 2024 presidential race and the 2022 gubernatorial race. For example, a county that ran 5 points more Republican than the rest of rural Oklahoma in 2024 and 3 points more Republican in 2022 enters the model as a county that runs around 4 points more Republican than rural Oklahoma. I tried several other ways of setting each county’s starting point and tested them against 28 previous elections. For some reason, this method was most (retroactively) predictive.
Next up, it starts thinking about conditions. Since Democrats running for governor in Oklahoma do better than Democrats running for president here, the model tries to guess at how far ahead Munson will perform relative to Kamala Harris. It uses two variables to answer this question. First, it uses the national mood as measured by the generic congressional ballot, a standard polling question that asks voters which party they plan to vote for Congress. Currently, it’s at around D+9, meaning a Democrat running for office is expected to perform electorally better than they might in a balanced environment. This has been historically true in Oklahoma as well, so the model uses the last four midterms to work out roughly what each point of national mood is worth in Oklahoma (A: Not much, but it’s something!) Second, it uses Oklahoma’s recent history, namely the average gap between the Democratic and Republican candidate in the last three gubernatorial races. The model then blends these two inputs. In the metro counties, national mood counts for 40% and recent history counts for 60%. In the other 74 counties, the blend is 30-70—historically, rural areas have been less affected by swings in the generic ballot toward the Democrats.
Finally, the model applies a couple small candidate specific bonuses. Munson gains 1.5 points in Oklahoma County, the same for Mazzei in Tulsa. Call it hometown advantage. If either candidate were from a rural area, the buff would be bigger. Alas, they are not.
All this together yields the model.
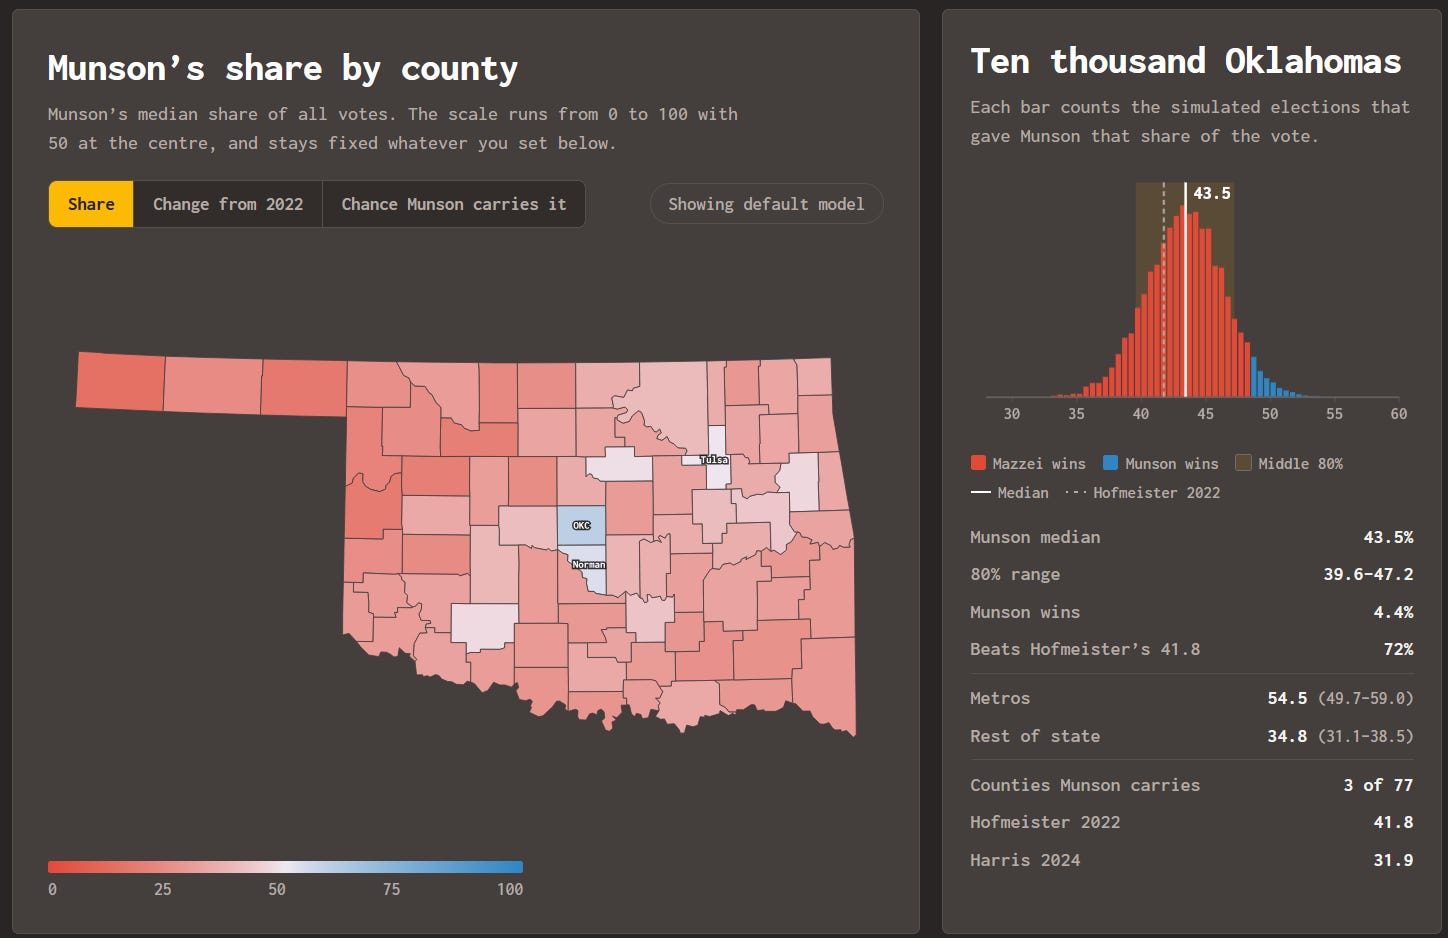
However, since we’re operating with heavy uncertainty and under questionable assumptions, the model doesn’t just run once. Whenever I made the forecast, I ran the model a few thousand times under different conditions, using inputs to ask it specific questions like “What if there’s a larger or smaller swing than we expect?” or “What if the metros are more or less Democratic than we expect?” or “What if historical regional divisions re-appear in this election?” etc. I also permitted some room for random chance on the county level: a few hundred voters making it to the polls in Harmon, a church bus running a bit too late in Tulsa. When you look at the forecast that the model produces, what it will show you is a few thousand different ideas of what the election could look like depending on how Tuesday goes.
All of this is contingent and arbitrary: if the data I gave the model is not the data it needs to make a good forecast, the forecast is going to be wrong. If the weights I put on the data are inaccurate, the forecast is going to be wrong!
Nonetheless, I stand by my model. I’m committing to these forecasts now, so you can score me on Wednesday:
Mike Mazzei will win the election. (95%+ chance)
Munson will probably beat Hofmeister’s 2022 performance in a more Democratic national environment. (~70% chance)
The biggest swings towards the Democrats will be in western Oklahoma. (~70% chance)
Munson may or may not keep Tulsa. (~50% chance)
For those of you who think I’m missing something, I have two words: prove it.
On the model forecast page, I have included a set of sliders that anyone can play with. I call it “MYOM” or Make-Your-Own-Model. If you think that any of my assumptions are wrong, then you can change these sliders and generate a new model according to whatever your little heart wants to believe.
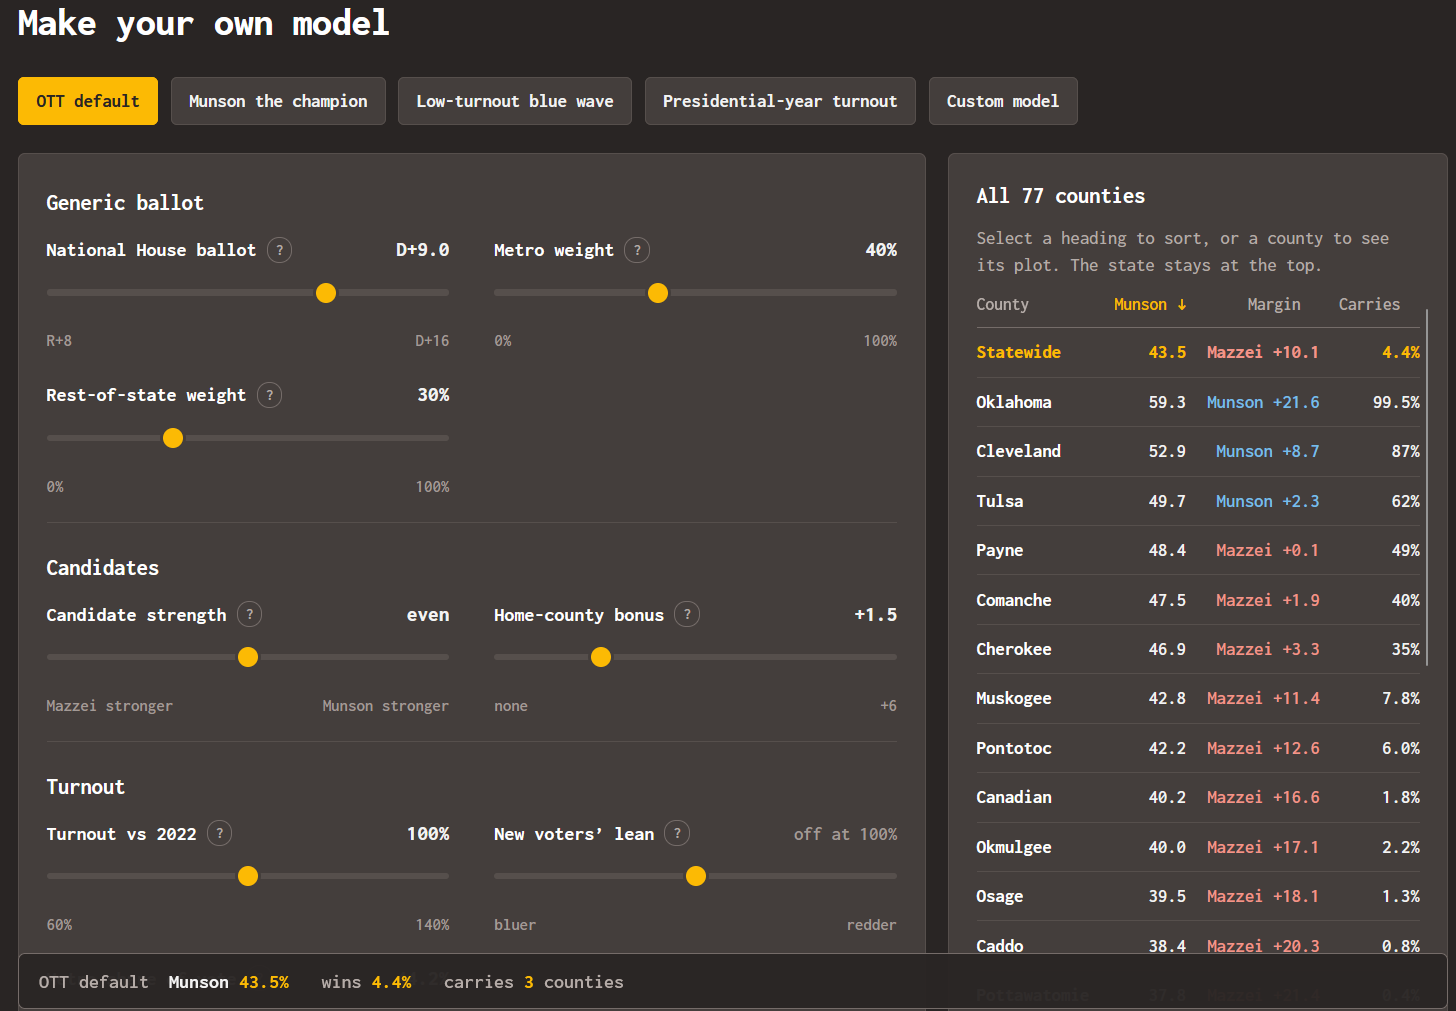
Do you think that energized new voters will turn out for Munson by the thousands? Model it! Do you think Mazzei’s popularity is underrated in his home city and former Senate district? Model it! Do you think rural voters are disillusioned enough that they’ll vote like the national generic ballot indicates? Model it! If you think I’m wrong, I am giving you the tools to show me how!
On Tuesday, the model faces its first real test. I’m looking forward to seeing how it fares.
You can find the model at ok26model.onlytothinking.com